Introduction
A powerful 7.2 magnitude earthquake hit eastern Turkey Sunday, October 23, 2011. The epicenter of the quake was in the village of Tabanli in Van province, near Turkey's border with Iran. Turkey is known to lie in one of the most active seismic zones and the country's most earthquake-prone region is near Lake Van. The coordinates of the epicenter was recorded as 38.628°N, 43.486°E. The worst damage hit the town of Ercis, causing caved in highways and the collapse of many buildings. Buildings are more vulnerable to quakes because it is made of adobe. A death toll of about 500 to 1000 people is estimated and still rising. In Van, terrified residents ran in the streets screaming while people buried alive were crying and groaning for help. Urgent help is needed. Emergency service workers searched frantically using their hands and shovels to pull and save people out of the debris. Phone lines and electricity had been cut. A number of strong aftershocks followed.Thousands of quake survivors are shivering in tents without heaters, blankets or toilets. Turkey's most powerful quake in a decade needs assistance. Remote sensing data obtained from satellites such as Landsat images can help determine where and when the most damage occurred and how critical the damage was. The biggest problem is that the death toll is expected to rise. It is important to assess earthquake damage by comparing before and after images of the location struck. Knowing where certain places such as homes, apartments, buildings and Universities are located helps find survivors. Finding survivors is the main priority at this time. Reconstruction of the area affected will shortly follow. Disaster relief is limited in Turkey and they need all the help they can get.
Study Area
This research focuses on the study of the areas of Van and Ercis, Turkey. A 7.2 magnitude earthquake decimated the Turkish town of Ercis. Apartment buildings were damaged and hundreds of people killed. An extremely dangerous aftershock at a magnitude of 5.6 hit Van Province on November 9, 2011. Again a lot of misery for the people who were already hit by the 7.2 magnitude earthquake in late October.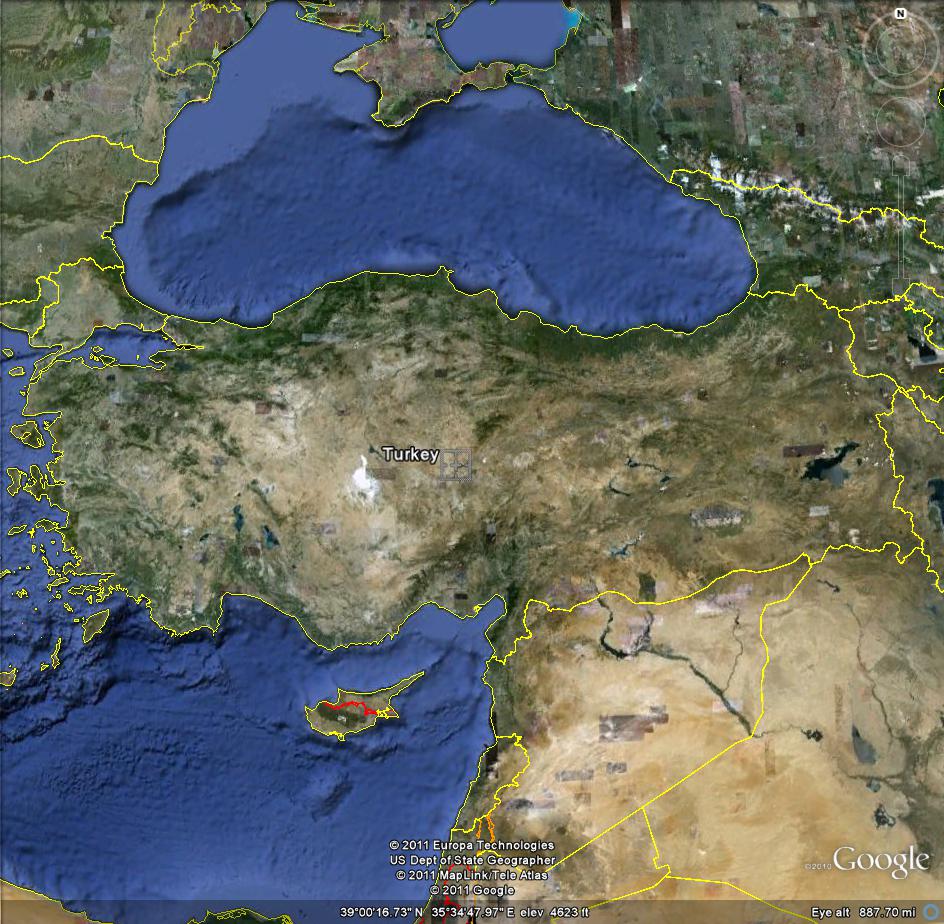
Turkey

Van and Ercis, Turkey

Recorded Earthquakes in Van and Ercis, Turkey

Van, Turkey

Ercis, Turkey
Methods
Vegetation and elevation comparisons was made between images of before and after the 7.2 magnitude earthquake in Ercis and 5.6 magnitude in Van, Turkey. Data could be download from virtually anywhere in the world! Landsat images from sensor enhanced thematic mapper (ETM+) were obtained online from Global Landcover Facilities from University of Maryland. In addition, SRTM images were downloaded from the Maryland Landcover Facility. The most recent Landsat ETM+ images were downloaded from Reverb Echo in the NASA website. A number of high resolution imagery were downloaded from the DLR ZKI - International Charter 'Space and Major Disasters' website. In addition, a high resolution poster was obtained from the USGS Earthquake Hazards Program. Google Earth was an important source for locating and saving JPEG images of the study areas. Obtaining Imagery Algorithm
Echo Reverb
First and foremost, registration is required to download data from the Echo Reverb website. Registration is quick and easy. After registration is complete and an account is created, there are basically two ways to search by location. For the purposes of this research, the exact coordinates for the 7.2 magnitude earthquake epicenter, obtained from USGS, was inputted under Spatial Search. However, another way of selecting the search criteria is to zoom in the world map to an area of interest and expanding the orange point to make a box, indicating the area of interest is within the perimeter of the box. Under Search Terms, specific satellites can be typed in to narrow the search options. For example, Landsat TM or MODIS can be typed in. Under Temporal Search, there is an option to choose a start to end date. The dates can be adjusted according to what time and date of the image is needed. The datasets will automatically be loading upon request. The second step of downloading data from this site is to select datasets. Multiple datasets can be checked and will be transferred to Step 3: Discover Granules. After selection is complete, click on Search for Granules. Accept the data quality summaries. A list of granules will appear on screen with 50 per page. There are three options for each granule. View spatial extents allows an individual to see a preview of the image on the world projection to the right. Zoom in the area of the granule to see a clearer and up-close view of the preview. More information about the granule can be opened by clicking on View more info. More information includes spatial extent, temporal extent, online resources, browse products, and browse access. There is also an option to show metadata. Most importantly, view more info is necessary to see the temporal extent, which shows the date of the image. Click on Add to Cart for every desirable image and View Items in Cart after selection is done. Check the granules to be downloaded and click on Download Selected. Save the images as a text file. Open the text file. The text file will have a URL. Copy and paste the URL to a Firefox (recommended) address bar to search. A USGS EarthExplorer page will open. In this page, a list of downloadable items or datasets will be provided. datasets unavailable for immediate download may be ordered and downloaded once it is ready. An email notification may be sent to the individual once the request is successfully processed and added to the on-line archive. The option to download is under Operations. Click this option and download the Level 1 Product! Do not download the Natural Color or Thermal images for these are JPEG. Remember to download the GeoTIFF image! For this research, Level 1 Products (GeoTIFF) were downloaded for September 29, 2011 and November 16, 2011. The September 29, 2011 ETM+ image indicates before the 7.2 and 5.6 magnitude earthquake. The November 16, 2011 image indicates after the 7.2 and 5.6 magnitude earthquakes. Bad values were repaired by making a subset of the bands 1, 2, and 3 and selecting Replace Bad Values under the Topographic tab in the ENVI toolbar. After choosing the subset to be repaired, Bad value = 0 and Min & Max = 0. Save the output to the ENVI Available Bands List. The repaired image will appear on the Available Bands List ready to load. A subset was created for both Van and Ercis, Turkey. Afterwards, a 3D image was saved as a JPEG to show in detail the nearby mountains.

Ercis, Turkey September 29, 2011

Ercis, Turkey 3D September 29, 2011

Van, Turkey September 29, 2011

Van, Turkey 3D September 29, 2011

Ercis, Turkey November 16, 2011

Ercis, Turkey 3D November 16, 2011

Van, Turkey November 16, 2011

Van, Turkey 3D November 16, 2011
Global Landcover Facilities
Google Maryland Landcover Facilties and navigate to Global Landcover Facility - University of Maryland. To the right, there is a download data section. Click on ESDI. Then, click on Map Search. The next steps are critical and need to be followed correctly. To the left are various satellites to choose from. To the right of this section, there is an interactive map with search options and tabs. The Lat/Long tab requires minimum latitude and maximum longitude values to search images. For most purposes, the Place tab is more commonly utilized. Under the Place tab, any specific place can be searched. Make sure to check the satellites of interest on the left column. For instance, under Landsat Imagery, ETM+ and TM can be checked. After the satellites are checked, search places by place or coordinates. Update the map to search images. If there is an error upon request, input a different name of the place or correct the coordinates to appropriate values. For coordinates, do not include the degree symbol or direction such as North (N) or South (S). In other words, just input the decimal value of the degree. After images are in selection, click Preview & Download. A list of images will appear for download. Each one can be clicked to see a preview. Click an image of desire and click download, located on top. A list of File Names will appear in a new page. It is recommended to download all bands. For this research, GeoTIFF files were downloaded. All bands were downloaded for ETM+ images of October 3, 2001. An important advice is to unzip the files at a desktop before transferring the extracted images to a storage drive. This process speeds up extracting and downloading. Subsets were created for both Van and Ercis, Turkey. Then, 3D images were saved as a JPEG for further visibility of detail. SRTM images for the year 2000 were also downloaded for inspecting slopes and 3D SurfaceView and motion controls (movie).

Ercis, Turkey October 3, 2001

Ercis, Turkey 3D October 3, 2001

Van, Turkey October 3, 2001

Van, Turkey 3D October 3, 2001
DLR ZKI International Charter 'Space and Major Disasters'
The DLR website helped in downloading high resolution maps previously produced by the Center for Satellite Based Crisis Information. The International Charter is a consortium of space agencies and satellite data providers that provide important space data acquisition and delivery in times of natural and man-made disasters. Google DLR natural disasters. Open the DLR - ZKI website. Under ZKI activations, there is a list including Interactive Map. Click on Interactive Map and see the various topics shown on the world map. Zoom into a topic of choice in a specific area. Click on the topic and open the link. Products can be download in low, medium and high resolution images. High resolution images require registration. High resolution images for the 7.2 magnitude earthquake were downloaded for this research . The images were then re-sized in Paint to fit in this blog.

24 October 2011, Reference Map - Turkey Van / Bitlis

24 October 2011. Geographic Reference Map - Detail - Turkey - Bitlis

24 October 2011, Geographic Reference Map - Detail - Turkey - Ercis

24 October 2011, Geographic Reference Map - Detail - Turkey - Van

25 October 2011, Geographic Reference Map - Detail - Turkey - Guvenli/Alakoy

26 October 2011, Damage Assessment Map - Detail - Turkey - Bitlis

26 October 2011, Damage Assessment Map - Detail - Turkey - Ercis

28 October 2011, Damage Assessment Map - Ercis - Turkey
USGS Earthquake Hazards Program
USGS scientists study earthquakes around the world. Turkey is known to be a tectonically active country that experiences frequent seismic events. The seism tectonics of the region near the October 23, 2011 magnitude 7.2 earthquake are controlled by the collision of Eurasian and Arabian plates. The Arabian plate converges with Eurasia at a rate of about 24 mm/yr at the latitude. West of the earthquake, tectonics are dominated by strike-slip faulting on the North and East Anatolian fault zones. In the area of Lake Van, earthquake tectonics are dominated by the Bitlis Suture Zone and Zagros fold and thrust belt. A poster in high resolution showing the tectonic setting, seismic hazard, finite fault model, epicentral region, and shake map has been downloaded. The image needed to be resized to fit this blog.

Google Earth
Google Earth is an incredibly satisfying program that allows the user to fly anywhere around the world to view satellite imagery, maps, terrain and 3D buildings. In addition, galaxies in outer space and the depths of the ocean can be viewed at a touch of a button. The Moon and Mars can be viewed in outer space. Zoom into a district close enough and change to street view. Street view allows viewing up close enough to see people in their cars. Furthermore, dicing beneath the surface of the ocean is also possible. For this research, certain layers were excluded. Images were saved by following the steps of File to Save and to Save Image. All layers were excluded except Earthquakes under Gallery to show the quake incidents in Van and Ercis, Turkey. Van and Ercis was labeled by flying to the destination. The country of Turkey is shown with coastlines and international boarders. Turkey was also labeled by flying to the country. All the images provided under Study Area for this research was obtained from Google Earth. These images are mostly for reference.
3D Imagery and Motion Control
Start ENVI and open an image by navigating to File and Open Image File. Locate the image (SRTM) and open. The SRTM image will be listed in the Available Bands List. Click on the band and open it in Gray Scale. Load the band. Do not worry if the image is white for this can be easily enhanced. From the Band toolbar, click on [Image] Linear 2% under the Enhance tab. If it fails to darken the image and turns whiter, reload the image and move the red box to a different spot and repeat the enhancing process until successful. The fun part is starting the 3D process. From the Band toolbar under Tools, click 3D SurfaceView. Select Input Band. In this case, the band for SRTM will be selected. Band information will appear and click OK. DEM min plot value should be 0 and vertical exaggeration can be adjusted to a higher value. Be sure to choose the spatial subset. click Spatial Subset and then click Image. The red box can be widen or made smaller depending on the size extent of study. Choose a desirable subset and click OK for all boxes. Under Options, Surface Controls allows the adjustment of vertical exaggeration and change of surface style. Motion Controls allows the ability to play movies by playing sequences. Zoom in and out by holding down the right click of the mouse and moving from left to right. The 3D image can also be moved around at different angles by holding down the left button of the mouse. Select desired sequence views and add each view as a list. When all views are selected, play the sequence. For ENVI, 5,000 to 10,000 frames should adequately play the movie without being too fast or slow. Save the movie by navigating to Save Sequence as MPEG under File. The number of frames should be as low as 50 or a 100 in order for Windows Media Player to play it properly. So, change the number of frames for the purposes of the media player. Choose the output file name and save.

3D View of Van

3D View of Ercis
3D Movie of Ercis
3D Movie of Van
Topographic Modeling
The SRTM image can also be significant in providing slope information. Navigate to Topographic under the ENVI main toolbar. Click Topographic Modeling and select input band. SRTM band 1 is chosen for this research. After clicking OK, Topo Model Parameters should open. Elevation should be 100 and Azimuth 90, but this depends on the individual's discretion. Enter the output file name press OK. A new file will appear under Available Bands List. Choose a feature according to interest and load the band. For instance, slope or aspect can be chosen. To load in color, simply apply bands to RGB and load. For example, RGB can be slope, aspect and shaded relief respectively. For this research, a spatial subset representing slope was created for both Van and Ercis, Turkey. Then, a 3D image was made and saved at various angles. A separate 3D movie was also made for both study areas. Slope, aspect and shaded relief was utilized to view in color. By checking the spectral signature, it allowed the comparison of elevation significances. White areas were found to be steeper than black areas. Higher slopes meant more damage from earthquakes.

Slope of Ercis

Slope of Van

Slope, Aspect and Shaded Relief of Ercis

Slope, Aspect and Shaded Relief of Van

3D Slope Ercis Side View

3D Slope Van Side View
Spectral Signature and Spatial Subsets
Making a subset of an image is easy once an individual is familiar with the steps. Locate File from the loaded image toolbar. Then, save image as and click image file. Choose a spatial subset of the full image. In this research, two subsets were chosen, one for each study area. Output File Type should be ENVI if it needs to be loaded from the Available Bands List. Output File Type should be JPEG if saving as an image to post on a blog for example. Name the file and click OK. The new file should appear on the Available Bands List as an ENVI file. Load the band. Spectral signature can uniquely identify objects. For instance, temperature can be determined by comparing spectral signature of land and water. Low values would indicate low temperatures and high values would indicate high temperatures. This comparison technique is efficient in determining where the burn scars are for fires. Burn scar would be hotter than surrounding areas. Spectral signature could be found by navigating to Tools in the loaded image toolbar. Then click on Profiles under Tools and click on X or Y Profile. Different targets can be clicked on the image to determine spectral signature.
NDVI
NDVI is efficient in determining the amount of vegetation in an area. For each image, bands 3 and 4 were opened and loaded. Red, green and blue were assigned as 4, 3 and 4 respectively. It is important to repair bad lines if necessary before transforming the image into an NDVI. Save Image As and make a subset of the image. Then, locate Transform on the ENVI toolbar. Click NDVI under the Transform tab. Choose the subset made for the NDVI. The NDVI band Red = 2 and IR = 3. Note that the computer reads the bands as Red = 1, Green = 2, and Blue = 3. Since green is band 3 on the band list, red should be assigned as 2. Save the output as an NDVI. White areas indicate greens or vegetation and black areas have no vegetation. 3D imagery has also been created to indicate the level of vegetation. More vegetation is higher in elevation whereas less vegetated are lower in elevation.

Ercis, Turkey NDVI September 29, 2011

Ercis, Turkey NDVI 3D September 29, 2011

Van, Turkey NDVI September 29, 2011

Van, Turkey NDVI September 29, 2011

Ercis, Turkey NDVI November 16, 2011

Ercis, Turkey NDVI 3D November 16, 2011

Van, Turkey NDVI November 16, 2011

Van, Turkey NDVI 3D November 16, 2011

Ercis, Turkey NDVI October 3, 2001

Ercis, Turkey NDVI 3D October 3, 2011

Van, Turkey NDVI October 3, 2001

Van, Turkey NDVI 3D October 3, 2001
Change Detection
Performing change detection allows the possibility to compare the amount of vegetation between two different times and determine whether there is a decrease or increase in vegetation. The older image must be opened in ENVI with bands 3 and 4. The more recent image should be opened as bands 5 and 6. Transform both images to NDVI. Then, locate Basic Tools under the ENVI toolbar. Click on Compute Difference Map under Change Detection. Select the Input Values in order. First, choose the older NDVI and click OK. Then, choose the more recent NDVI and click OK. Check normalization data range. Save output and press OK. Load the change detection result shown in the Available Bands List. Blue areas indicate decrease in vegetation or greenness and red areas mean increase in vegetation or greenness. 3D imagery for both Van and Ercis, Turkey were created to represent the level of vegetation lost between two different times. Notice that the blue areas are loss in vegetation so the elevation is lower than the red areas.

Ercis, Turkey from October 3, 2001 to September 29, 2011
 Ercis, Turkey 3D from October 3, 2001 to September 29, 2011


Van, Turkey from October 3, 2001 to September 29, 2011
 Van, Turkey 3D from October 3, 2001 to September 29, 2011


Ercis, Turkey from September 29, 2011 to November 16, 2011

Ercis, Turkey 3D September 29, 2011 to November 16, 2011

Van, Turkey from September 29, 2011 to November 16, 2011
 Van, Turkey 3D from September 29, 2011 to November 16, 2011


Ercis, Turkey October 3, 2001 to November 16, 2011

Ercis, Turkey 3D October 3, 2001 to November 16, 2011

Van, Turkey from October 3, 2001 to November 16, 2011
 Van, Turkey 3D from October 3, 2001 to November 16, 2011

Results
A dramatic change was seen according to the results that indicate a clear distinction between before and after imagery of the 7.2 and 5.6 magnitude earthquakes in Turkey. A significant loss of vegetation is evident and elevation images show nearby mountains that are most vulnerable to earthquake damage. There is no questioning Turkey's location being one of the world's most active and deadly seismic zones. 3D Elevation Imagery and Topographic Modeling
As shown above, 3D imagery produced by SRTM GeoTIFF files for both Van and Ercis have dangerous mountains with high elevation nearby. The range goes from white as being most dangerous to earthquake damage to black as least dangerous. Black areas are mostly vegetation and cities with residential properties. Lighter colors up to white is mostly mountains and hills. There is little to no residential life in these areas. If it wasn't for these high elevated mountains, the damage to the cities of Ercis and Van would not have been as critical.
Topographic modeling was extremely helpful in verifying the differences in slopes for the high elevated mountains nearby Van and Ercis, Turkey. Checking the slope values by spectral signature determined results for white areas being higher in steepness and black areas have little to no incline or steepness. Comparing the elevation imagery to these slope images, it is clear that more damage was caused by white areas. Black areas with people present would not have been affected as badly if it was not for the high inclined mountains. the slope, aspect and shaded relief showed more detail by color. Again, spectral signature determined the slope of each color. The range goes from red as being highly steep and blue as not at all steep. Comparing the elevation imagery of Van to that of the slope, aspect and relief, the most red visible is where the highest elevation is present nearby. This highly inclined mountain is extremely close to the city of Van. The slope, aspect and relief image of Ercis also shows that the white areas from the elevation image matches the red areas. Elevation and slope imagery is evidence of why Turkey suffered a huge impact from the earthquakes. The 3D slope views of Ercis and Van show which area has the highest slope according to elevation.
NDVI
NDVI is efficient in determining whether there was an increase or decrease in vegetation by visually comparing two images of different dates and noticing the changes of the amount of vegetation. Vegetation is clearly abundant in Ercis and Van, Turkey in the Landsat imagery taken on September 29, 2011 and October 3, 2001. White areas mean highest vegetation and black areas mean no vegetation. The range is from white to black. There is barely any change in vegetation between these two dates. 3D imagery taken for both Van and Ercis, Turkey for both dates indicate high elevation, which means high vegetation. Ercis and Van Landsat imagery taken on November 16, 2011 clearly show the loss in vegetation. Recall the high elevation area near Van recorded in elevation and slope images. With this in mind, it seems that a significant amount of vegetation to the left of this area disappeared and died possibly due to the 7.2 and 5.6 magnitude earthquakes. The 3D imagery indicates a significant drop in elevation towards the mountains. The elevation is lower and there is also no light so it should be a reduction of vegetation. This change in vegetation proves how devastating the earthquake was to the people of Van, Turkey living nearby. On the other hand, what seems to be a loss in white color or vegetation might be due to snow coverage. This possibility of being snow coverage is concluded in change detection. Not to mention, Ercis was also heavily damaged by the earthquakes and it is evident by the discoloration in vegetation. Although, clouds cover much of the area preventing the clearest visibility, it shows that the difference in lightness between before and after the earthquake is crucial. Looking at the 3D imagery for this area, it is noticeable that the elevation is not continuous. Instead, it drops at one point and drops again, indicating a loss in vegetation. Some high elevation areas could be clouds. The darker gray areas indicate clouds when compared to the original imagery of Ercis obtained from Echo Reverb. The bottom and top of these clouds are visible and it is seen that light white is almost completely lost.
Change Detection
Change Detection is absolute and definite evidence of the changes in vegetation between the NDVI images of different dates. Blue areas mean decrease in vegetation and red areas mean increase in vegetation. The range goes from red with darker red meaning more increase and blue with darker blue meaning more decrease. Clouds were determined to be red. The darkest red seemed to be water. Also, snow was visible as blue because of covering the vegetation. I am assuming that the loss of vegetation from October 3, 2001 and September 29, 2011 is due to urbanization and replacing vegetated areas with buildings, roads and homes. The Ercis change detection between September 29, 2011 and November 16, 2011 indicate heavy loss of vegetation. The loss of vegetation can be misinterpreted by snow coverage. Van, Turkey change detection from September 29, 2011 to November 16, 2011 displays vegetation loss after the earthquake in the city. This result proves the collapse of buildings and damage done to vegetation in the city due to the earthquake. It also proves that the assumption of vegetation loss left of the highest elevated mountain near Van from the NDVI images were due to snow coverage. Van, Turkey change detection from October 3, 2001 to November 16, 2011 show even more decrease in vegetation than the Van change detection performed only on the year of 2011. The assumption that the 2001 area experiencing more damage than 2011 proved to be true. More damage is visible from the top, right and bottom of the city of Van. There is clearly more blue in these areas than the areas observed in 2011. The 3D imagery provided for all change detection images allow a clearer understanding of the amount of vegetation lost. Considering the fact that this much vegetation was lost in just a little over a month, it is fairly conclusive that the area was immensely damaged by the quake.
Discussion
Conclusions
Obtaining data from online was challenging in that not all data was useful. The availability of imagery is limited because of the temporal resolution for the Landsat ETM+ data. A repeat time of 16 days must be waited in order to download new data. The imagery is not guaranteed to be of good use due to cloud coverage. Imagery obtained from Echo Reverb for November 16, 2011 had some cloud coverage for Ercis but was still used for Van. Unlike Ercis, there was also barely any snow coverage on Van so this data was useful. Imagery from October 31, 2011 was removed from this blog because the cloud coverage made it very difficult to see any results. Therefore, making NDVI and change detection comparisons between the 7.2 magnitude and 5.6 magnitude earthquakes was omitted from this research. The purpose of this research was to determine whether the 2001 area or 2011 area was more damaged due to the earthquake. Vegetation damage assessment was successful but specific results for Ercis was difficult due to cloud and snow coverage. However, there is enough evidence that Ercis experienced a high damage from the earthquakes. It was also unfortunate that the images loaded in ENVI could not be saved as JPEG as closer views of the area. Focusing in on the city of Ercis and Van needed to be avoided and instead be generally analyzed along with its surroundings.
Comparing with Other Research
Damage assessment by the scientists of DLR ZKI International Charter 'Space and Major Disasters' is incredible in that it provides the highest resolution images with zoomed in inset boxes to show specific buildings that collapsed. Buildings that collapsed are categorized as highly damaged to not so damaged. My research contains information on elevation and slope, along with change detection of vegetation loss, to prove the effects of the earthquake. Research competed by the scientists in USGS Earthquake Hazards Program basically represents the geology of the earthquake. It involves earthquake depth, seismic hazard expressed as peak ground acceleration, earthquake magnitude, rupture front contours plotted every 5 seconds, population exposure, and the intensity of the earthquake. Ont he other hand, my type of research has never been done before and is the first to explain such information on how elevation and slope can affect vegetation as well as increase damage in earthquake-prone areas. Furthermore, there has never been research done on the comparison of 2001 and 2011 data to determine which time of area was affected more by the earthquakes.
Future Avenues of Research
Future Research and help for vegetation conservation and the people of Turkey is desperately needed and encouraged. New data from Echo Reverb is available for download every 16 days. It is recommended to check for updates and new images for Ercis. The most recent imagery on Ercis after the earthquake is covered with clouds and snow. In the future, performing NDVI and change detection for Ercis will be possible and more accurate than the ones shown in this research. Also, the city of Van cannot be ignored. A 5.6 magnitude earthquake is damaging enough to continue research on this city. The DLR website can further perform damage assessment on Van in order to locate and save the people in need. The people who are living in camps also need help. So, providing shelter and food is possible when doing damage assessment. Further corrections and addition will be made to this research as time allows.
References
"10/23/2011 — Another 7 Mag This Week = 7.3 Magnitude Earthquake in Eastern Turkey." Dutchesinse = Sincedutch. Web. 29 Nov. 2011. <http://sincedutch.wordpress.com/2011/10/23/10232011-another-7-mag-this-week-7-3-magnitude-earthquake-in-eastern-turkey/>.
"DLR - ZKI - International Charter 'Space and Major Disasters'" DLR - ZKI - Home. Web. 01 Nov. 2011. <http://www.zki.dlr.de/project/261>.
"DLR - ZKI - International Charter 'Space and Major Disasters'" DLR - ZKI - Home. Web. 01 Nov. 2011. <http://www.zki.dlr.de/project/261>.
"ENVI Software | Image Processing & Analysis Solutions from Exelis." Exelis Visual Information Solutions, Image Processing & Data Analysis. Web. 25 Oct. 2011. <http://www.exelisvis.com/language/en-us/productsservices/envi.aspx>.
"GLCF: Earth Science Data Interface." GLCF: Welcome. Web. 28 Oct. 2011. <http://glcfapp.glcf.umd.edu:8080/esdi/index.jsp>.
"Google Earth." Google. Web. 01 Nov. 2011. <http://www.google.com/earth/index.html>.
"IGoogle." Google. Web. 01 Nov. 2011. <http://www.google.com/ig?referrer=ign>.
"Make an Earthquake in Your Browser - JavaScript / DHTML / AJAX | DaniWeb." DaniWeb IT Discussion Community. Web. 20 Nov. 2011. <http://www.daniweb.com/web-development/javascript-dhtml-ajax/threads/337232>.
Region, YearBy. "Poster of the Eastern Turkey Earthquake of 23 October 2011 - Magnitude 7.1." U.S. Geological Survey Earthquake Hazards Program. Web. 10 Nov. 2011. <http://earthquake.usgs.gov/earthquakes/eqarchives/poster/2011/20111023.php>.
"Reverb Echo." National Aeronautics and Space Administration. Web. 26 Oct. 2011. <http://reverb.echo.nasa.gov/reverb/#utf8=%E2%9C%93&spatial_map=satellite&spatial_type=rectangle>.
U.S. Geological Survey Earthquake Hazards Program. Web. 01 Nov. 2011. <http://earthquake.usgs.gov/>.